
How can we use data to determine how similar different Irish tunes are?
Using machine learning, manifold learning, and dimension reduction, to determine what makes tunes sound the same or different

Previously, I discussed the “feeling” of different modes:
Tunes in a major key (also called Ionian mode) tend to sound bright and happy.
Tunes in a minor key (also called Aeolian mode) tend to sound sad or growly.
Tunes in Dorian mode are more similar in sound to minor key, but are more brooding and mysterious in tone.
Tunes in Mixolydian mode are more similar to major keys, but are less happy and more frantic or rebellious in tone.
To a person’s ear, dorian sounds more like minor than major, and mixolydian sounds more like major than minor. Someone more educated in music theory than I probably has a great answer for why this is. However, there should be a way to use the data contained in the notes in a tune to determine its character, with no music theory required!
I began with a simple question. How could a person go about comparing how similar or different two tunes are? There are many valid answers, but the easiest from a data driven approach is by investigating: what kind of notes does a tune contain, and how often are those notes repeated?
I took all tunes in thesession.org database, and transposed them to the key of D (preserving the mode, so D major, minor, dorian, and mixolydian). For tunes with multiple versions, I took the average of all those versions to represent the tune. Then, for each tune, I (virtually) took all the notes in a tune and threw them in a bag. Imagine grabbing a note from a tune’s bag. For a classic Dmajor tune like The Silver Spear, your chances of pulling out the notes in a Dmaj chord (D’s, F#’s, and A’s) is probably pretty high!
Lets test this out with two tunes already in native Dmajor: The Silver Spear and The Mountain Road. The histogram below essentially shows the odds of picking out each of the 12 possible notes in the bag (there are 12 notes by half-steps in an octave between C4 and C5). As you can tell by eye, these tunes are remarkably similar! Your odds of grabbing a D, F#, or A are each ~20-25%. Neither of these tunes contains any accidentals (in their base version), and thus you have a 0 percent chance of grabbing say a D#, F♮, or G#. C#’s, E’s, G’s, B’s are all notes that make up the subdominant (G), dominant (A), relative minor (B), or diminished A7 chords; all classic components of a tune in Dmajor! We can explain the presence or absence of every note in the histogram from music theory, a strong validation of the data processing thus far.
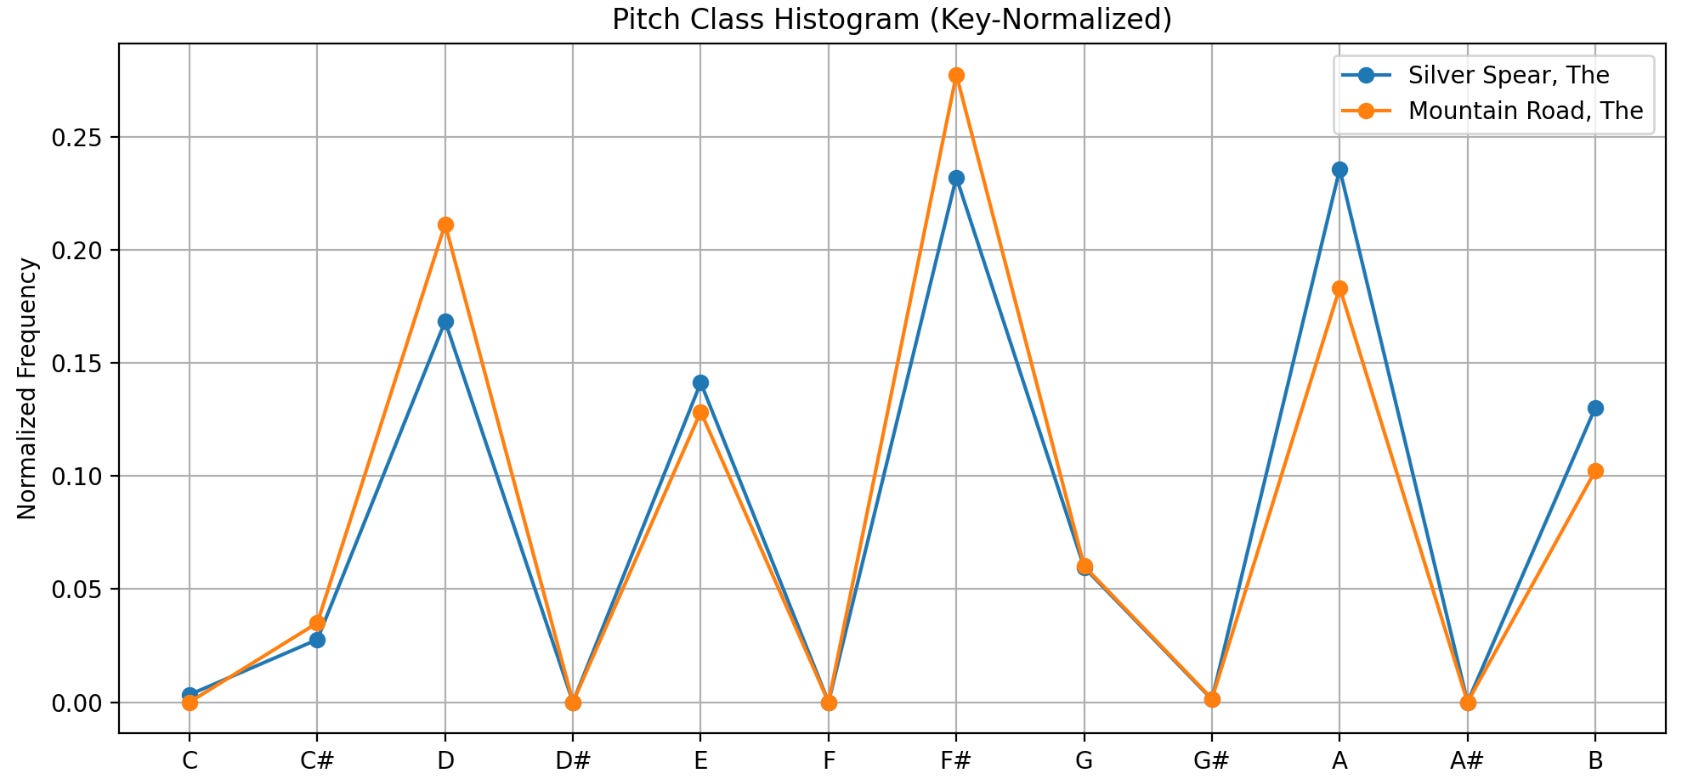
To my ear these tunes have always sounded similar, and the data backs that up too! Now, we can see by eye, based on where the peaks and valleys of this histogram line up, that these are likely similar tunes. However, our eyes and our brain are complex systems! How do we do train a simple computer program to recognize similarities and differences? The answer is machine learning, and in this case, an algorithm for clustering by similarity called UMAP (nitty gritty details are at the end of this post). Below is a plot showing the full database of Irish tunes from thesession.org, with each tune being represented by a point in this plot. The closer together a pair of points are, the more similar they are. As one might expect, tunes cluster by mode! Dorian and minor modes particularly similar, and major key tunes are most similar to tunes in mixolydian modes! I find this to be particularly useful as a sanity check for this approach as it’s what our ears tell us as well!
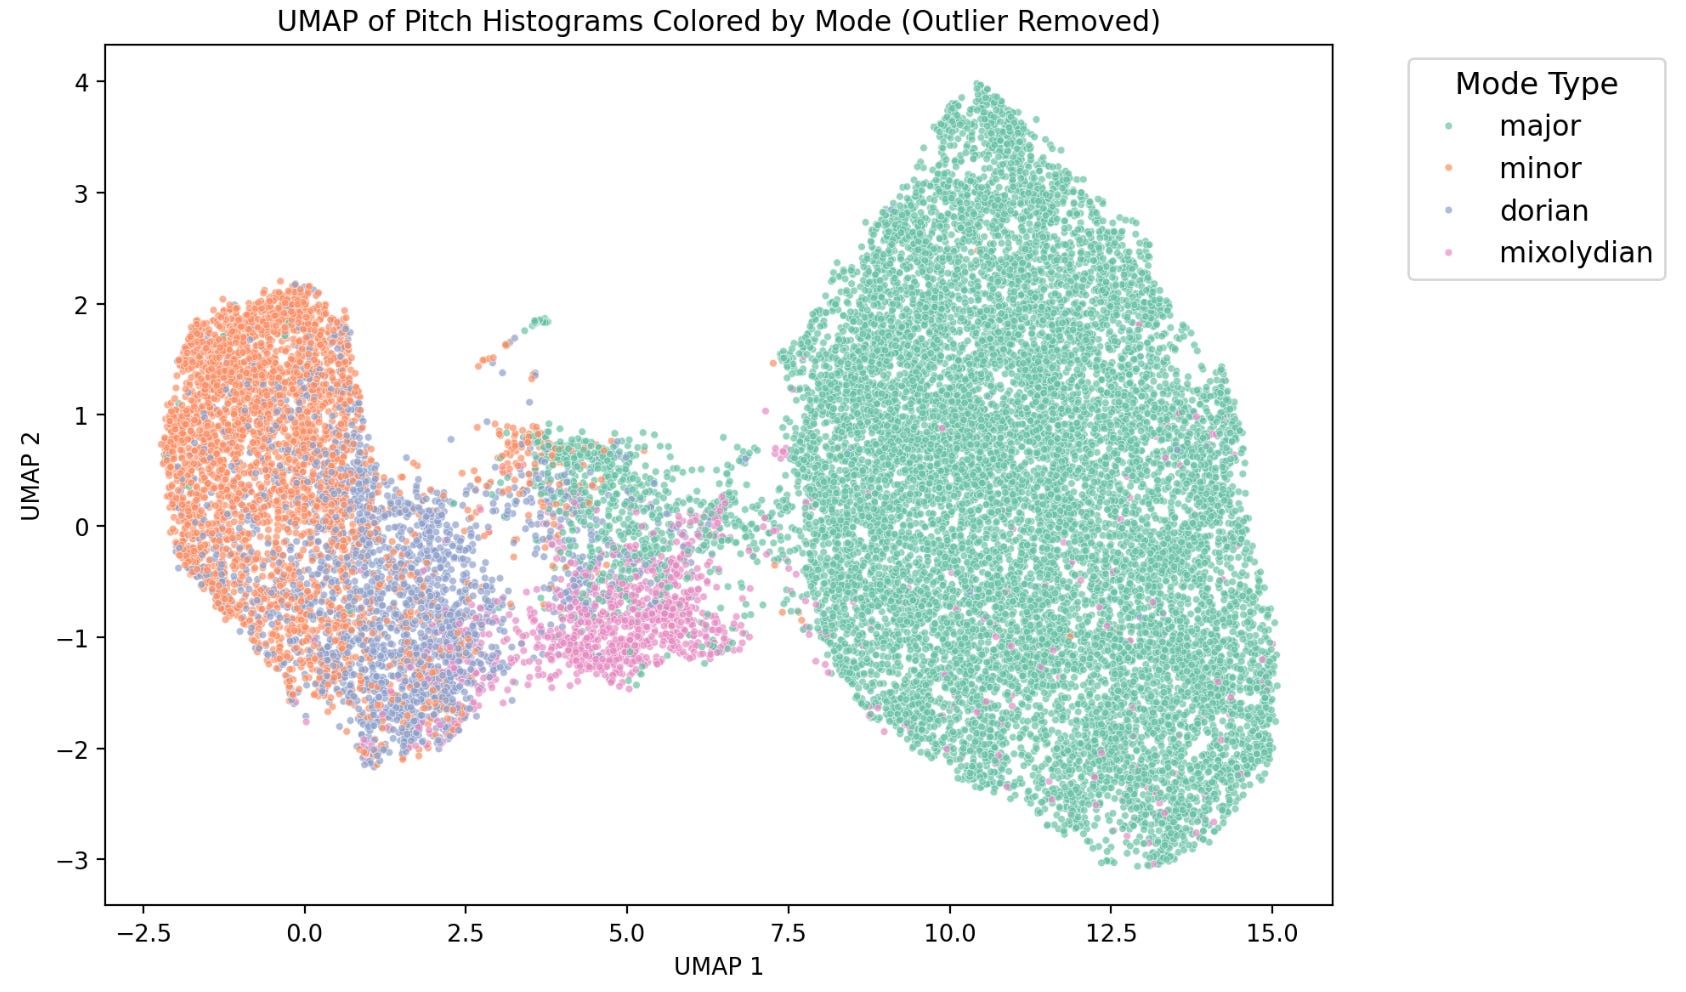
While there are clear clusters by mode, you may also notice a number of interlopers in clusters they don’t belong to! There are two main explanations for this phenomenon.
The first is that a user needs to input a mode when submitting an abc formatted tune to thesession.org. User error is certainly an option, maybe the user chose to label a tune E dorian, when really it’s closer to B minor. This choice would have no effect on the actual transcribed music, so the only people that might care about it would be a hapless data scientist, or backing instrument players looking for a hint for the right chords to play in the abc data.
The second explanation is there are plenty of Irish tunes out there that are multi-modal! Some tunes have a clearly delineated mode change between the A and B part. Some tunes flirt with multiple modes throughout. Some musicians I’ve met even express a presence for these tunes with murkier keys!
“I’m not a data scientist, I’m a musician, what’s the takeaway?”
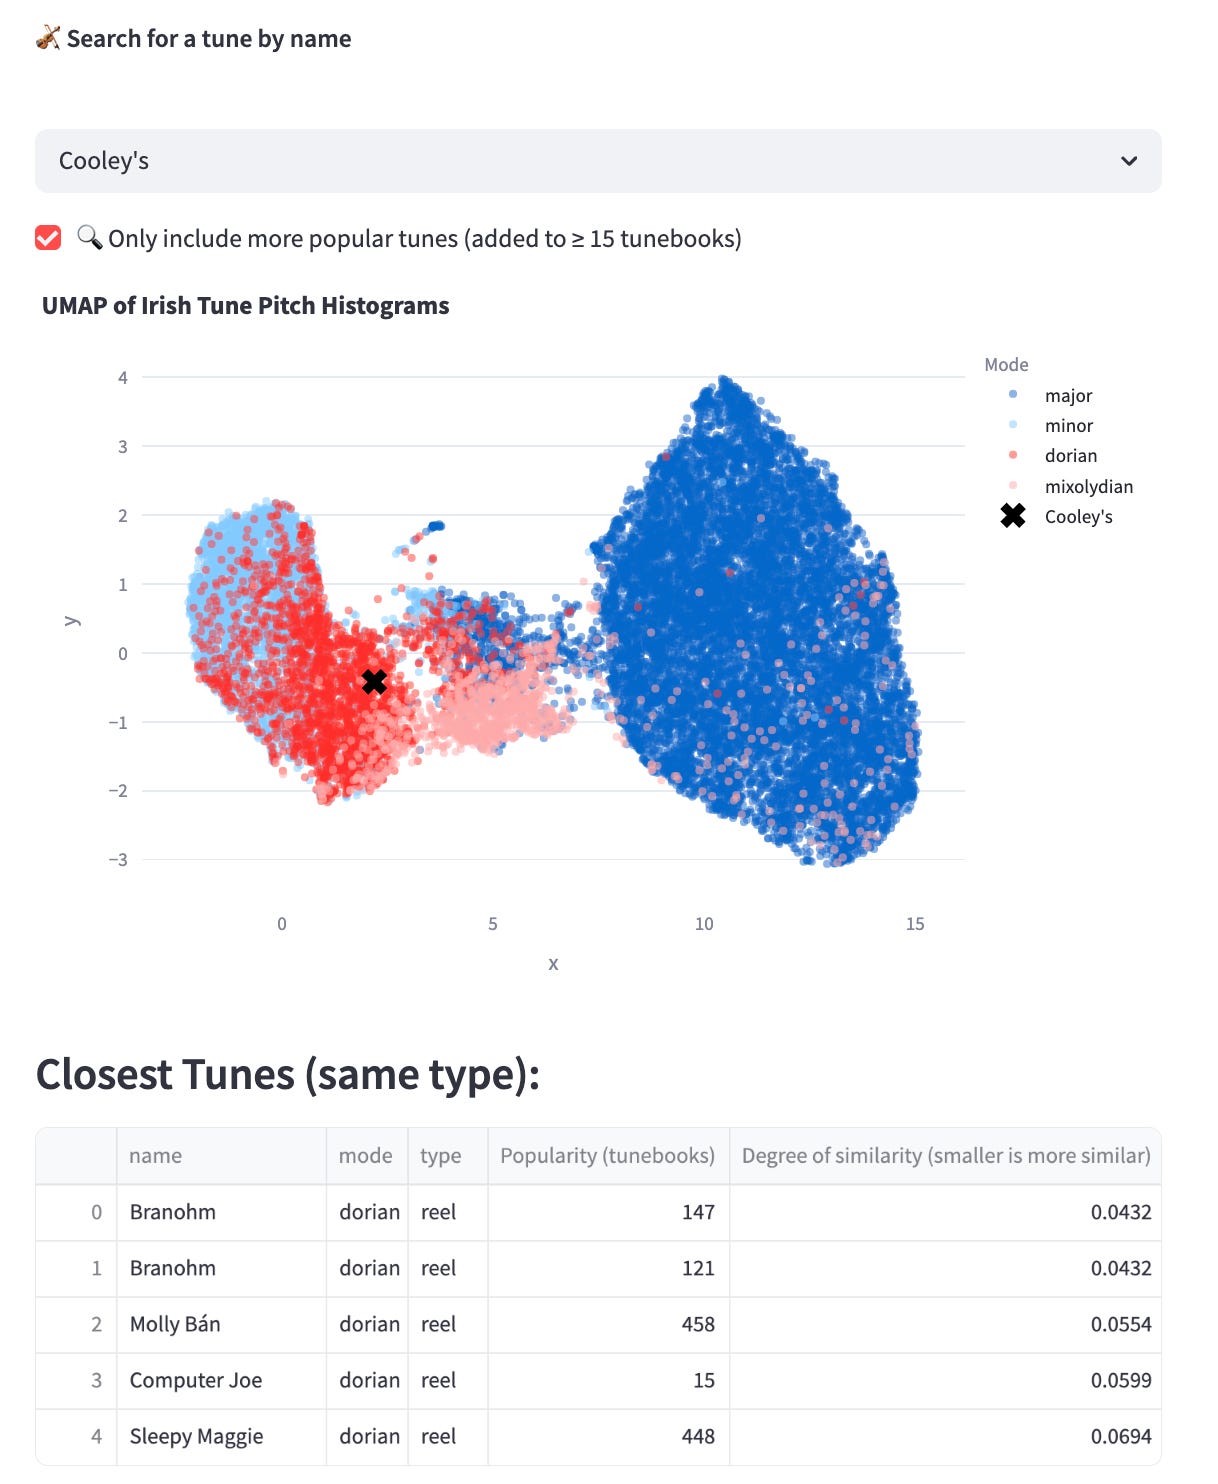
Consider you really like The Silver Spear, and you just want to find some tunes similar to it to learn. Using the web app I developed here you can search for any tune and check out a list of the five most similar tunes of its type (reel, jig, etc.), according to my analysis. It looks like this:
More insights into tune similarity
thesession.org gives us additional interesting data to work with, namely, the popularity of every tune! This is measured by how many people have added a tune to their personal tunebook. I hypothesize that tune popularity from thesession.org is a function of two things: the first is actual popular preference for a tune, and the second is how beginner-friendly a tune is. If you’re just getting started in Irish music, these are the first tunes your teacher or local sessioneer are going to recommend, and will be your first bookmarked tunes in your online tune book. This hypothesis is confirmed by a brief analysis of the top 30 most popular tunes according to thesession.org.
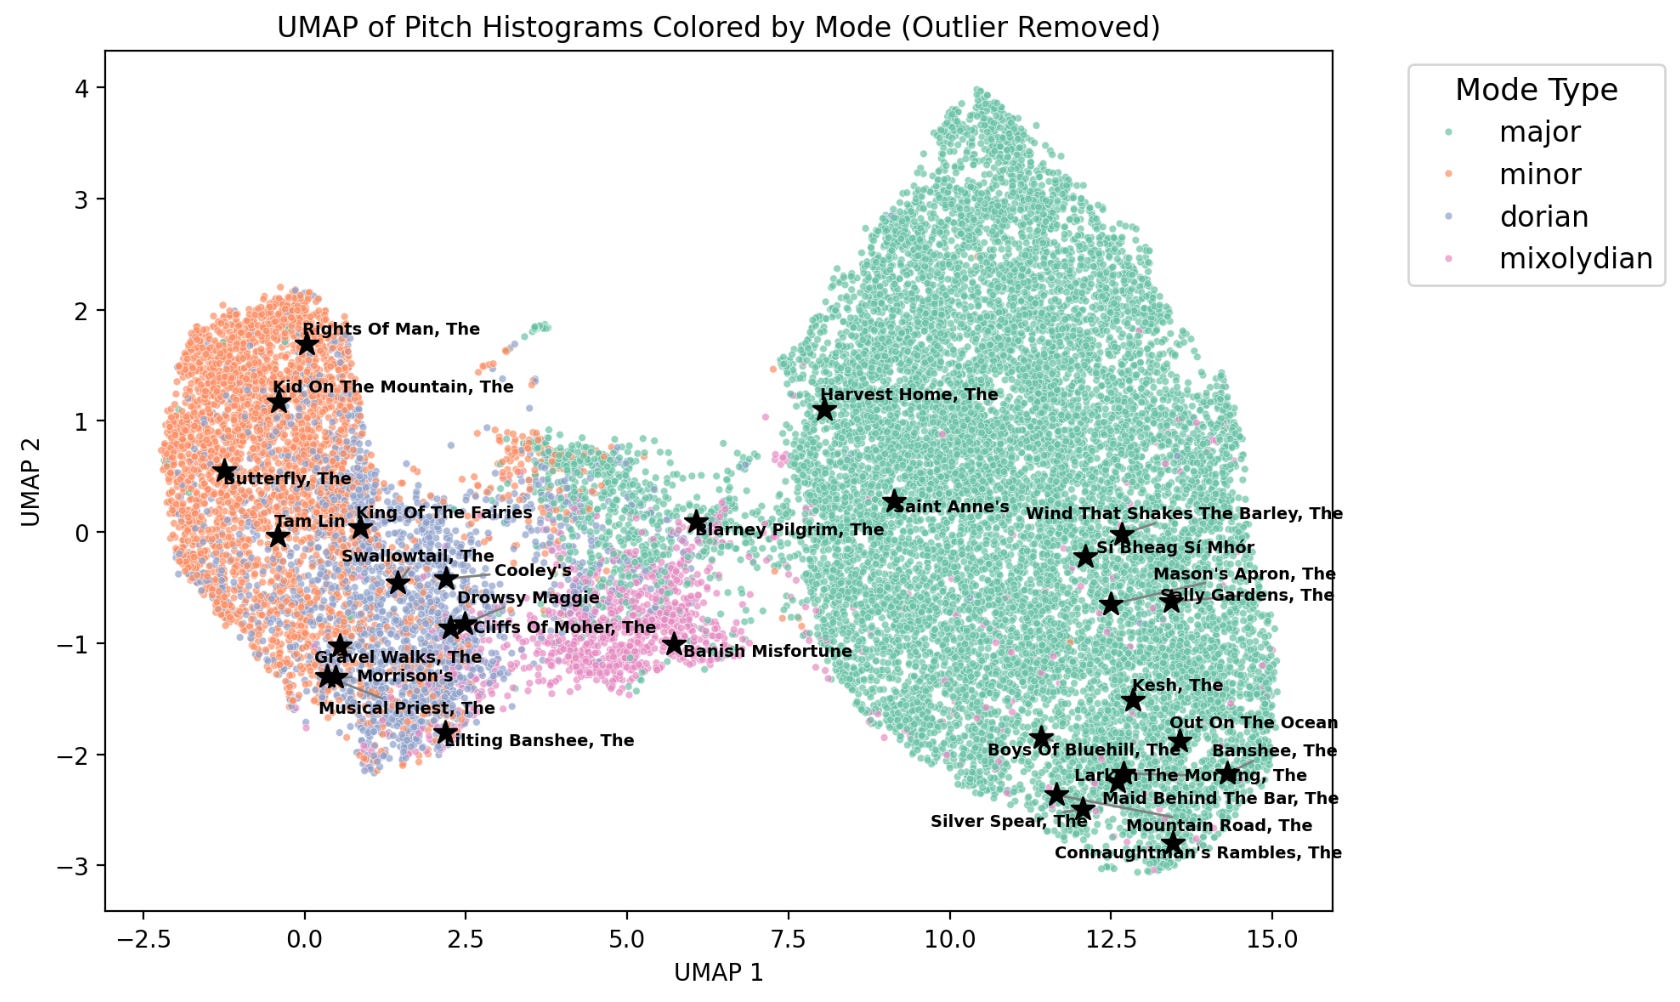
If you’re a connoisseur of Irish music, you’ll easily recognize a bunch of common and beginner friendly tunes in here. The sub-clusters of these tunes are particularly interesting. At the bottom right, a bunch of simple reels and jigs in major keys are represented. These are likely tunes with similar, beginner friendly patterns of notes. We can also conclude that, relative to the top 30, mixolydian mode tunes are not as popular as the other modes!
Limitations and areas for future work
At the moment, my model simply considers how likely you are to grab particular notes out of a bag of all the notes in a tune jumbled together. However, a key component of what makes music music is the order in which notes appear, and are arranged in phrases or cadences! This is pretty complex for this kind of model to try to deal with, if only there were some sort of deep learning model designed for recognizing these kinds of patterns, to be the subject of a forthcoming post…..
Nitty gritty details for the data science enthusiasts
The data cleaning process for this data set is complex but doable! The abc format needs to be parsed to extract the individual notes. Here is an example of the abc representation of the following piece of music:
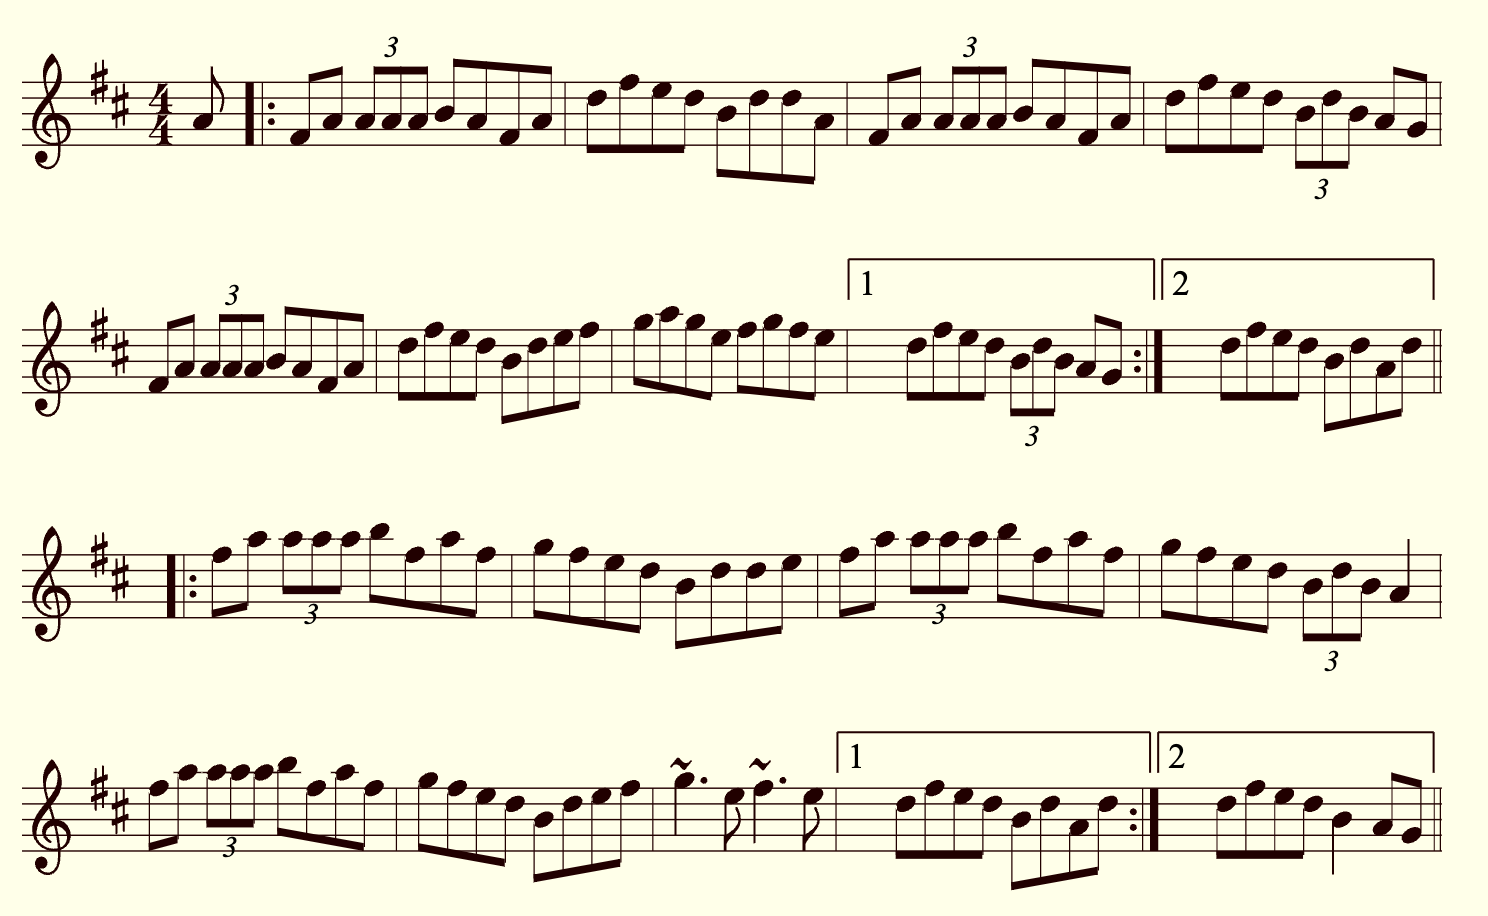
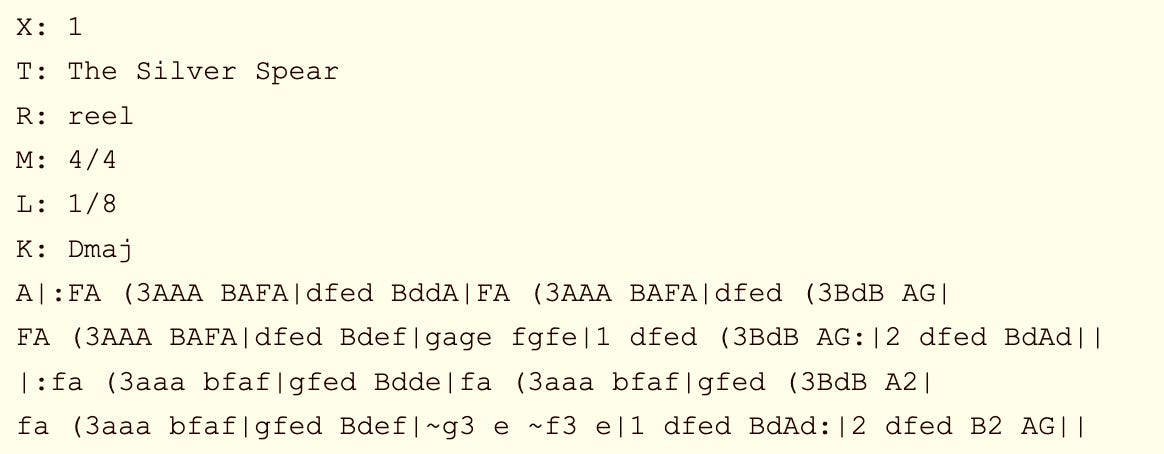
The python package music21 is particularly useful for parsing the abc format into a dataframe, as well as for transposing all tunes to a common base tonic. Because many tunes have multiple versions, the dataframe must be grouped by tune name, and the pitch histograms averaged, so that each tune only has one entry.
UMAP (Uniform Manifold Approximation and Projection) is a popular dimensionality reduction technique used to visualize high-dimensional data in 2D or 3D. The input data has 12 dimensions. While humans are generally good at visualizing up three dimensions, like shown below, we struggle with anything higher, much less 12 dimensions!
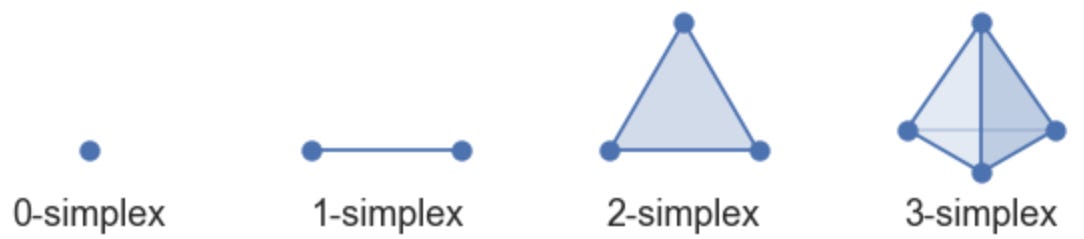
Machine learning algorithms also struggle with high-dimensional data sets in a number of ways, commonly referred to as the curse of dimensionality. A number of algorithms are particularly well suited to reducing dimensionality to make a better model. I chose to use UMAP, which works by modeling the data as a graph, where nearby points are connected, and then tries to create a low-dimensional representation that keeps these relationships as close as possible.
Like t-SNE, UMAP helps reveal structure in complex datasets by preserving the relationships between data points — for example, clustering similar items together — but it's typically faster and better at preserving the overall shape or "global structure" of the data.
From a practical standpoint, UMAP is great for exploring data, detecting patterns, and uncovering natural groupings (like clusters or outliers). While its two axes are high-dimensional spaces that are difficult to interpret, it’s advantage over say t-SNE is the distance across the axes is directly related to the similarity between different points.
Stay tuned for part 3, where I present a tool to take your mystery tune and use machine learning to tell you what mode it’s in!
I'm intrigued by your pitch histograms. Do you weight by note length? i.e., would a whole note count for as much as a 16th note?
Also the histograms don't have a concept of ordering for notes, so I think the following two tunes would have the same pitch histogram, despite sounding extremely different to the ear (I rearranged the notes in each measure, but didn't changes pitches or lengths)
X: 1
T: Off She Goes
R: jig
M: 6/8
L: 1/8
K: Dmaj
|:F2A G2B|ABc d2A|F2A G2B|AFD E3|
F2A G2B|ABc d2e|f2d g2f|edc d3:|
X: 2
T: She Went Off (my own creation)
R: jig
M: 6/8
L: 1/8
K: Dmaj
|:F2 B A G2| AA c d2 B|F2 B A G2|A E3 DF |
F2B A G2|eA d2 cB |ff2g2 df|ec d d3:|